All Resources
Insights & Reports
What Happens After CMS Says "Yes, Yes, a Thousand Times Yes"
A Shoulder Replacement Case Study

A Shoulder Replacement Case Study
The Bottom Line: When CMS makes a procedure ASC-payable, the shift is fast, measurable, and concentrated in certain territories. Here's what total shoulder arthroplasty can tell us about where the site-of-service mix for hundreds of procedures is headed.
In July, we broke down the 2026 OPPS Proposed Rule and called it a gold rush. The first tranche just hit: 285 procedures came off the inpatient-only list on January 1. The remaining 1,400+ will phase out by January 2028, and most of those will become ASC-eligible along the way.
But policy changes don't move markets all on their own. Surgeons, facilities, and patients do. So we looked at what happened on the ground for a procedure that's already been through this transition: total shoulder arthroplasty (CPT 23472).
The short version: ASC share went from under 10% to over 30% in just two years.
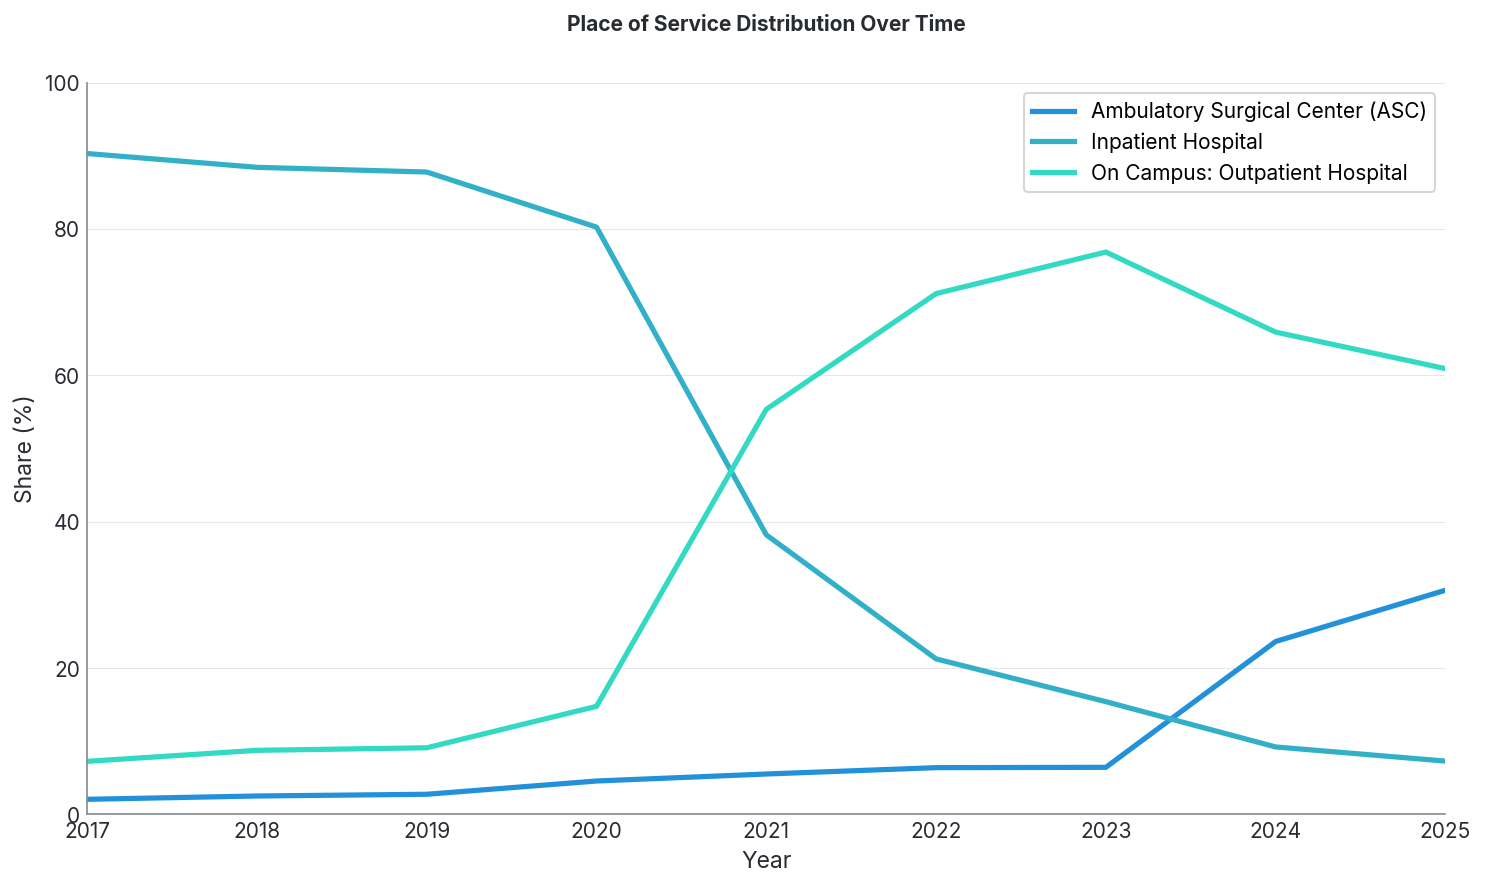
Two inflection points worth noting.
When CMS removed it from the inpatient-only list in 2021, inpatient share cratered from 80% to 38% in a single year. Hospital outpatient absorbed most of that volume.
In 2024, when ASC eligibility kicked in, ASC market share nearly quadrupled, from 6.4% to 23.6%. By 2025, it's over 30% and climbing.
National averages tell part of the story, but early ASC adoption shows up unevenly across states.
We looked at state-level ASC volumes for shoulder arthroplasty in 2023 and again in 2025, right after ASC eligibility went into effect.
.png)
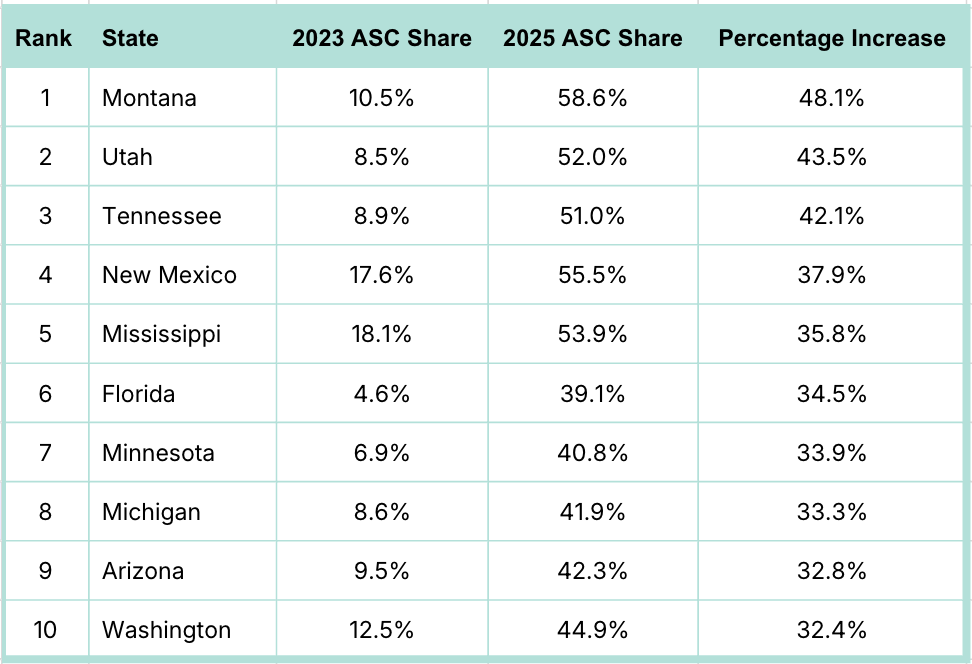
In terms of market share growth, Utah and Tennessee went from single-digit ASC market share to majority ASC, a fundamental rewiring of where care happens in those states. Montana led the way with a 48-point increase.
Here are the top 10 states in ASC market share growth:
In terms of volume, Florida alone added nearly 6,500 shoulder replacement claims in the ASC setting in 2025 compared to 2023, and that’s as we await complete 2025 Medicare data from CMS (MedScout doesn't blend estimates/projections with real-world data).
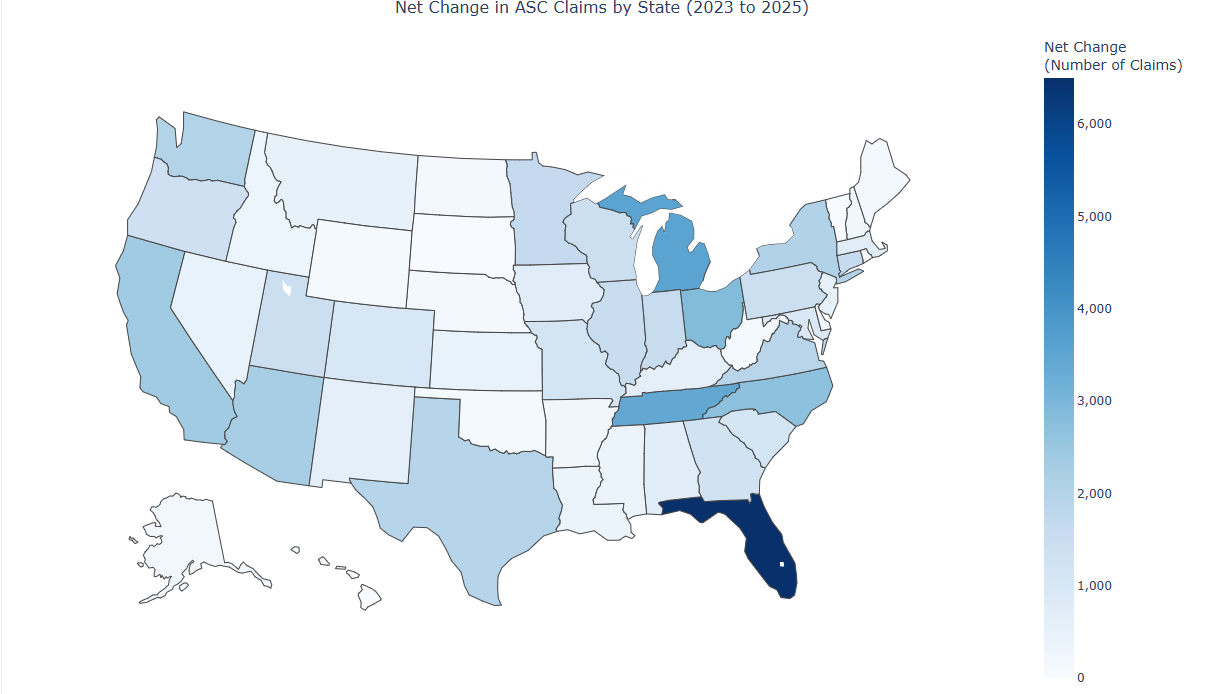
And here are the top 10 states in claims growth:

There will be fast adopters.
Montana, Utah, Tennessee, New Mexico and Mississippi all had over 35% ASC market share growth. These may not be the highest-volume markets, but they move fast. If you have the headcount to expand into new territories before competitors do, these early-mover states can give you a head start.
There will be volume engines.
Other states drive opportunity through absolute volume. Florida, Michigan, and Tennessee account for 13,000+ more shoulder replacements done in ASCs in 2025 than in 2023. If this is an indicator of what will happen with other procedures, these high-population, ASC regulation-friendly states represent the most significant near-term revenue opportunities.
There's a sweet spot.
Tennessee ranks third in both volume and growth, with Florida, Michigan, Arizona, and Washington also appearing in the top ten of both lists. These markets are seeing rapid site-of-care migration alongside meaningful volume expansion, making them strong candidates for a concentrated ASC-focused strategy.
We also looked into another procedure, total ankle arthroplasty (CPT 27702), which followed a similar CMS path: off IPO in 2021, ASC-payable in 2024.
There are way fewer ankle replacements than shoulder replacements, so it may not tell as strong as a story. But there has been a similar shift in place of service, at a slightly slower pace.
ASC share of ankle replacements:
Inpatient hospital dropped from 70.4% to 8.3% over that same period. Same directional story, just a different pace.
Procedures coming off inpatient-only move the market considerably. Total shoulder arthroplasty shows how policy changes can play out on the ground.
If your procedures became ASC-eligible (or will in the future), forecasting assumptions probably need to be revisited. Shoulder replacements went from 6% to 30%+ ASC share in two years. Some states are now at over 50% ASC. If territory plans and quota models assume gradual drift, you're building on a faulty foundation. More to come on what we’re building to help.
A note on state-level data: Data can be affected by payer coverage and claims availability within that state. Use as strong directional signals, not 100% precise forecasts.